
11.18 Graphs
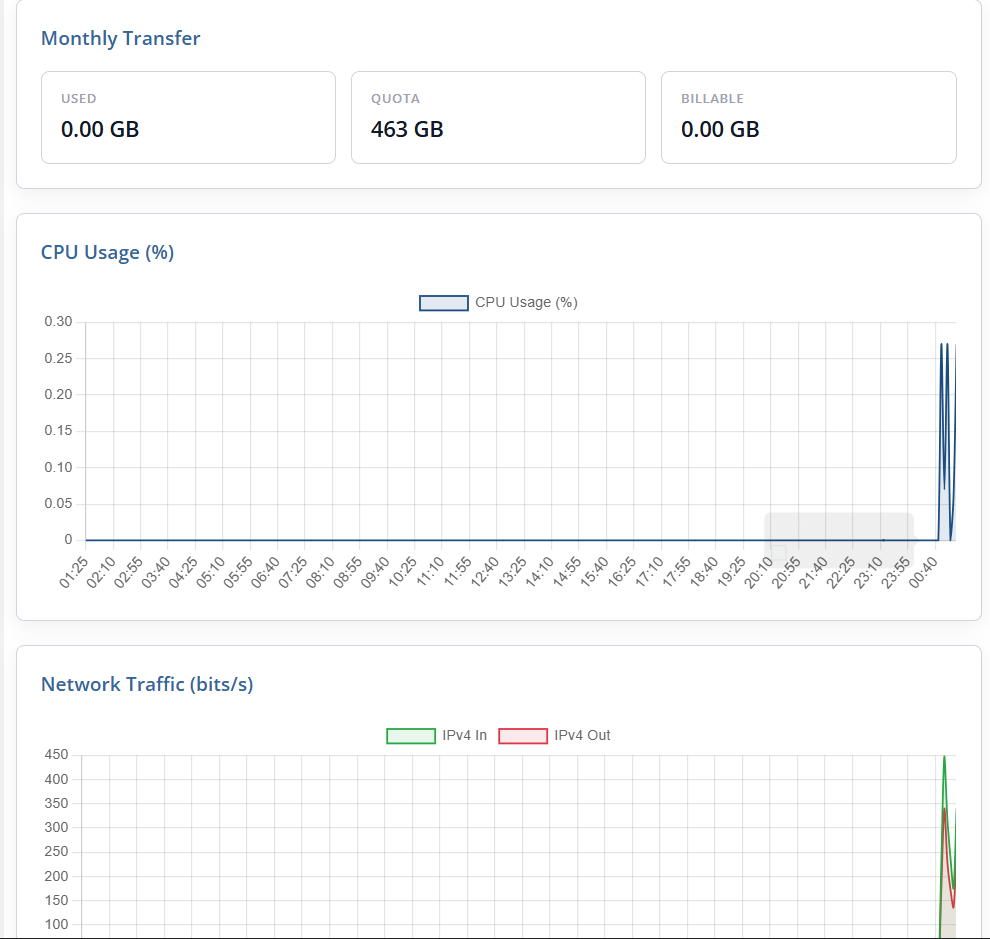
Shows the current month’s transfer usage (used, quota and billable), followed by CPU usage, network traffic and disk I/O charts for the last 24 hours.
Note: Linode only reports statistics once an instance has been running for a few minutes. Until then the page shows an explanatory notice rather than empty charts.